My Approach:
Collaboration, grounded in human-centered design and agile practices, that enables teams to see, align to, and improve the holistic flow of delivering value.

This page highlights a few of the key principles and practices that are foundational to my ideology and craft:
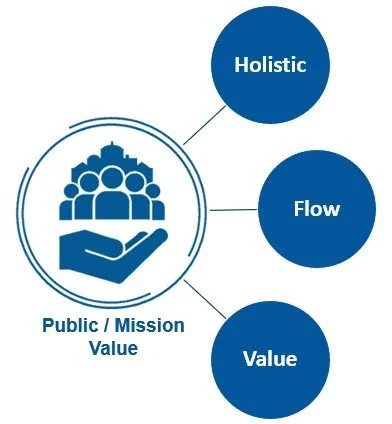
Holistic Flow of Delivering Value
Holistic: Strategic Design
Align teams to a shared, big-picture view
Define the problem and desired outcomes
Design and iterate solutions
Flow: Agile / Service Design
Engineer flow — from trigger to value delivered
Discover interdependencies
Identify and address constraints and friction
Value: Customer-Centric / Data-Driven
Understand customers — they define “value”
View services as the co-creation of value
Quantify value delivered
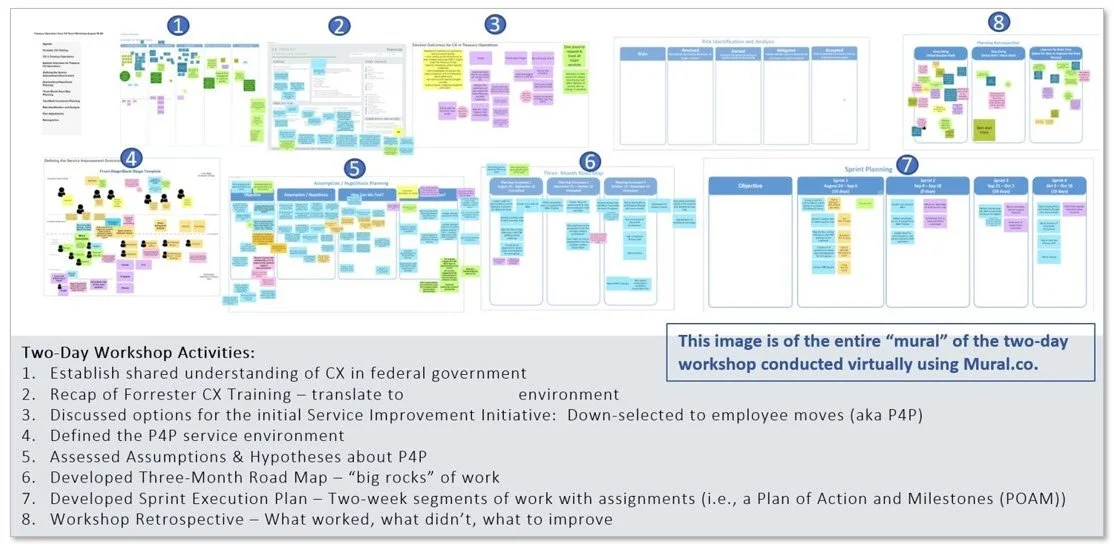
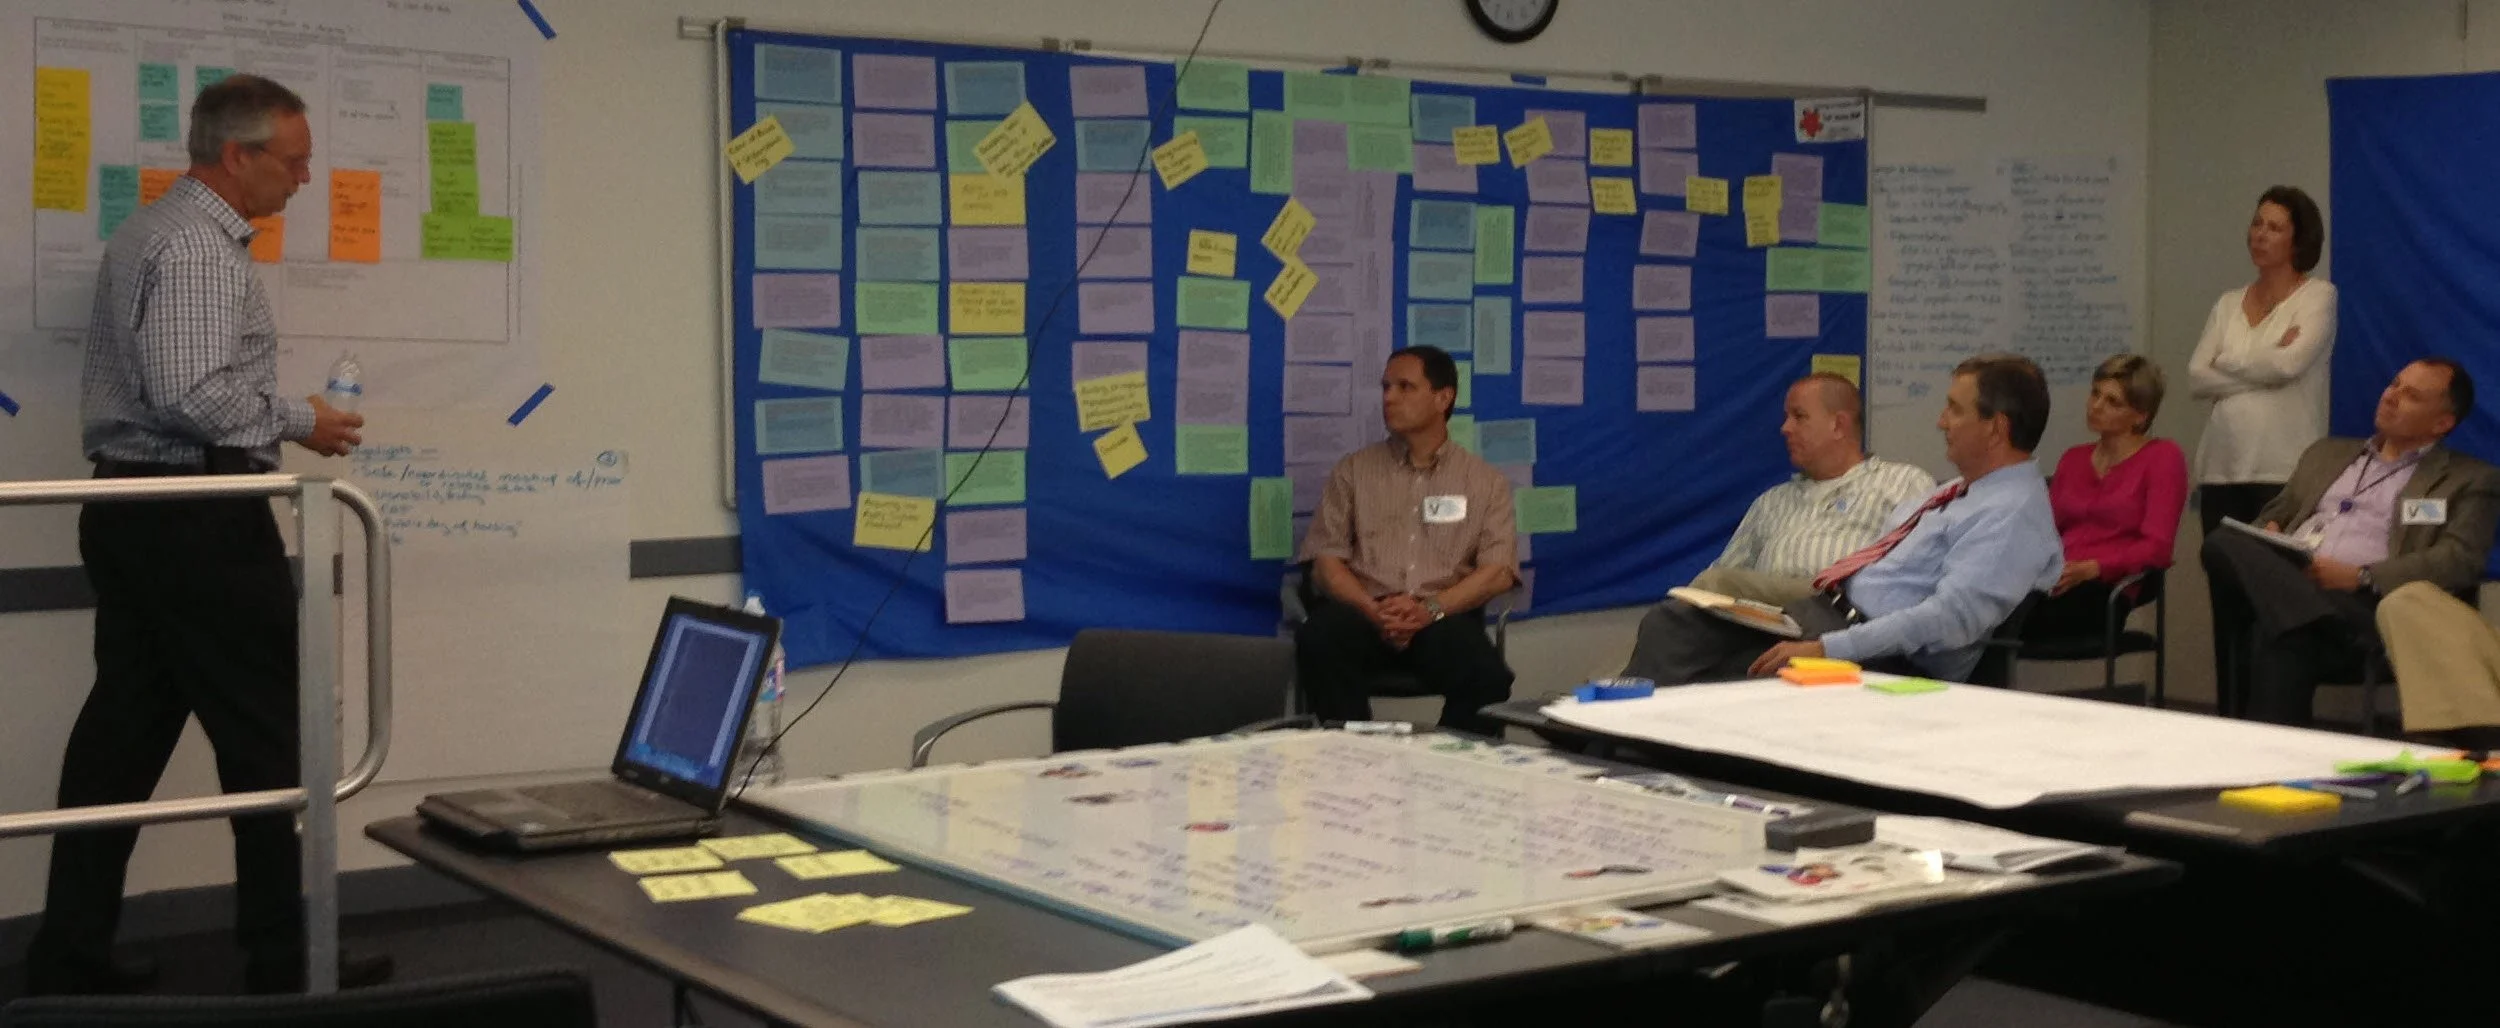
Collaboration
I have facilitated numerous in-person and virtual co-design sessions, ranging from strategic design, product/service design, and Agile Program Increment planning.
Large-format visuals, time-boxed activities, small working groups, and dot voting keep the sessions flowing, give everyone a voice, and generate actionable results.

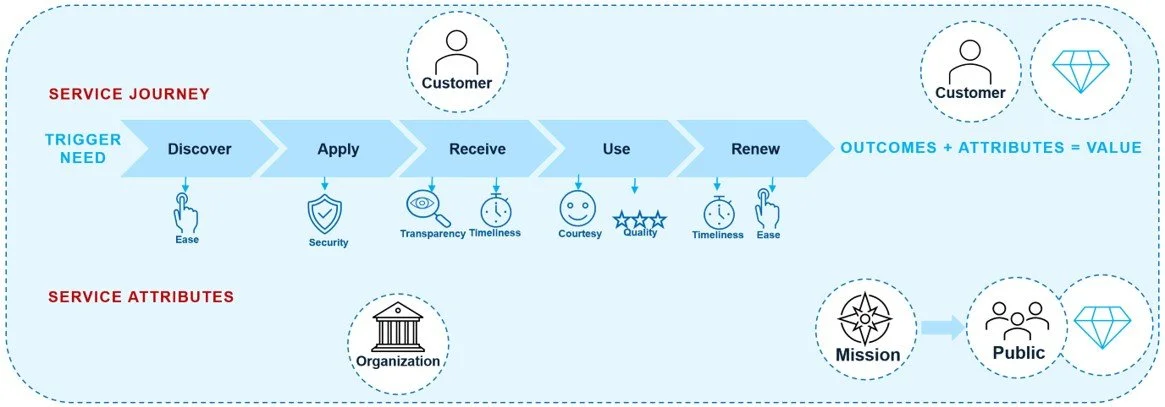
Services: the Co-Creation of Value
A service is the series of interactions (“flow”) between a customer (consumer) and an organization to co-create value.
The mission of a government agency is to deliver public value.* A service journey (or value stream) maps the stages from customer need to outcomes, as the customer and agency co-create public value.
Customers and the public define the value of a government agency through three dimensions:
Outcomes: Achieving their goals by successfully completing a task or “job to be done” (e.g., receiving a benefit, filing taxes, visiting a national park).
Attributes: The quality of the product or service, including ease of use, transparency, security, timeliness, courtesy, and equity.
Efficiency: The agency’s effective stewardship of taxpayer resources through operational efficiency.
*Moore, M. (1995). Creating public value. Cambridge, MA: Harvard University Press, pp. 52-56
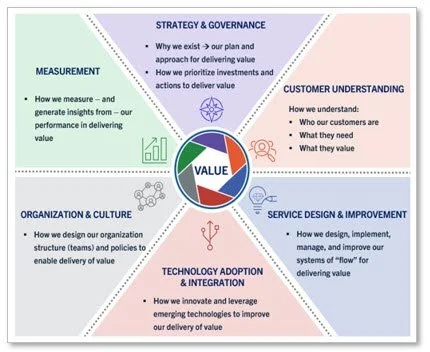
Optimized Operating Models
Since 2022, I’ve worked with agencies to design operating models that align business and IT for digital transformation.
An operating model defines how an organization works together to deliver value.
An optimized operating has six core elements – shown in the graphic as an aperture – designed to focus and align the organization on delivering mission value.
Define, understand, and prioritize value
Strategy & Governance, Measurement, Customer Understanding
Shared definitions of value, consistent metrics, and aligned priorities
Design, implement, and improve the systems that deliver value
Organization Design & Culture, Service Design & Improvement, Technology Adoption
Cross-functional teams, flow-based delivery, and effective use of technology
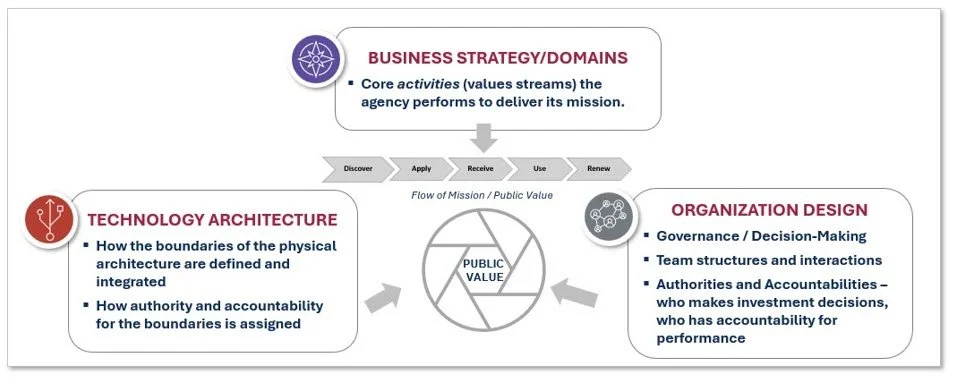
“Isomorphism – the quality of related items having similar structures.”*
An ideal operating model aligns the Technology Architecture structure and Organization Design structure (especially authorities and accountabilities) to the same structure as the Business Strategy and domains – that is, how an organization delivers public value.
I use disciplines like Domain-Driven Design, Team Topologies, and Technology Business Management to help organizations transform their operating models to align and integrate business and IT.
I also use John Kotter’s eight stages of organizational transformation** as the framework for planning executive engagements and developing transformation roadmaps.
*Kim, G. & Spear, S. (2023). Wiring the Winning Organization. Portland, OR: IT Revolution, p. 207.
**Kotter, J. (2012). Leading change. Boston, MA: Harvard Business Review Press.
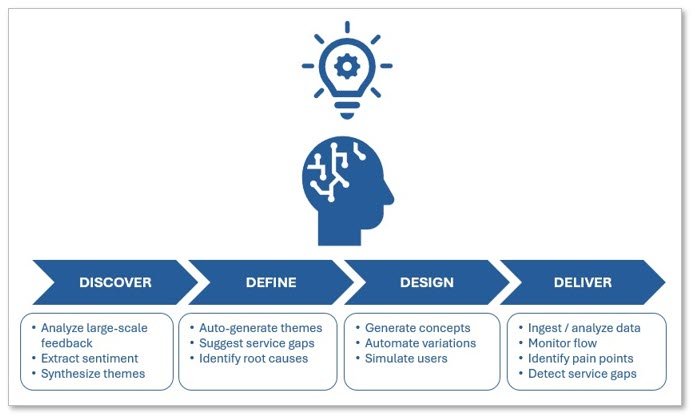
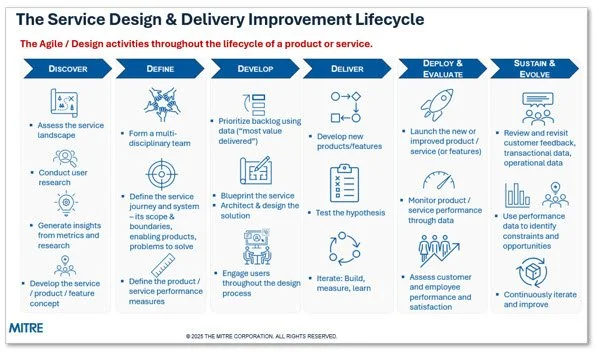
Agile Service Design and Delivery
Agile, lean start-up methods are core to how I practice design.
I view services as solutions to continuously improve through iterative, data-driven design and delivery.
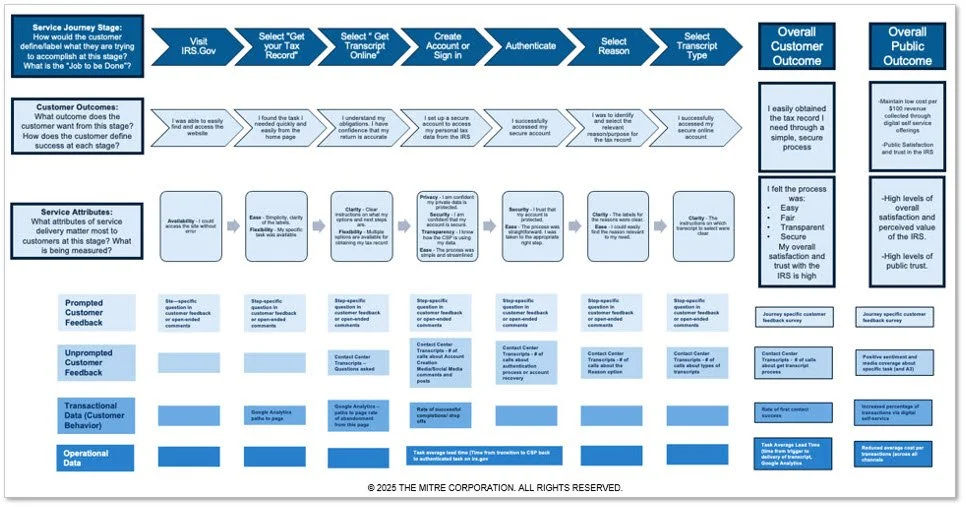
I created this visual for a sponsor to highlight the key stages and activities of a service design and delivery lifecycle.
To effectively measure service journeys, start by defining the outcomes and service attributes that matter to customers at each stage and for the journey overall.
Then identify available data sources that measure the outcomes and attributes.
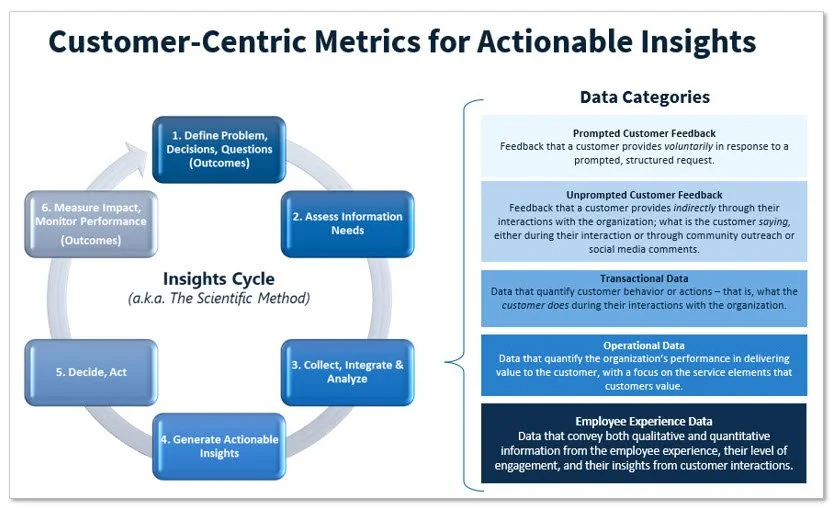
Customer-Centric Measures
To improve customer experience and service delivery, organizations must integrate and analyze diverse data sources to uncover holistic, actionable insights that reflect the full customer journey and internal performance drivers.
I created these visuals to help agencies identify and map diverse data sources to service journey stages and outcomes.
Advances in AI are making this integration and analysis faster, more scalable, and more robust – enabling real-time pattern recognition, predictive insights, and smarter decision-making across complex data ecosystems.
Leveraging AI
I’m passionate about exploring how AI can enhance human-centered design. Key ways AI is already supporting this work include:
Insight discovery – Tools like Medallia, NICE, and Qualtrics XM Discover use AI to extract key themes, sentiment, and pain points from large volumes of customer feedback.
Accelerated collaboration and mapping – Platforms like Miro and Lucidchart embed AI to support journey mapping, process visualization, and team alignment.
Design and prototyping – Figma’s AI features speed up wireframing, content generation, and design iteration, helping teams bring ideas to life faster.
These capabilities apply and enhance the principles and practices I have used for years. For me, these tools aren’t just about efficiency, they’re about enabling smarter, more adaptive, and truly responsive service design.