Modernizing Census Data Dissemination
Strategic Design & Culture Shift
The Challenge: The Census Bureau needed to shift from static data products to dynamic, open data that empowers diverse users to make timely, data-driven decisions — requiring a transformative, not cosmetic, change to its dissemination model.
The Outcomes: “There are two important legacies from this work, as that experience ventilated our siloed activities. Today, Census has an enterprise solution for dissemination. The second consequence is it helped paved the way for siloed centers of activity to collaborate and share resources, which has led to their very consequential Transformation Initiative. I think you impacted the culture, helping make this possible.” — Steve Jost, co-chair, Census Data Dissemination Task Force
The Team
My role: As lead strategy designer, I directed the strategy design process and facilitated a five-week series of full-day co-design sessions with the Data Dissemination Task Force, shaping the vision and roadmap for transformation.
Team members:
The Data Dissemination Task Force members was a cross-functional team of 16 executives from across the bureau. The five MITRE team members were project managers, system engineers, and business strategies.
Strategic Design Activities
Problem definition and scoping
Future state scenario development
Business model generation
Capability definition and integration
Outputs and Outcomes
Outputs: A comprehensive roadmap that integrated critical change activities for the following five capability areas:
Enterprise Data Dissemination Governance
Metadata Standardization
External Data Services
Enabling Technology Platforms
Customer Experience Management
Outcomes:
A unified, cohesive team of executives with a shared vision created from a group of diverse stakeholders with competing interests.
Shift toward a culture of collaboration and resource sharing, paving the way for an enterprise data dissemination capability (see below) and more extensive organization transformation.
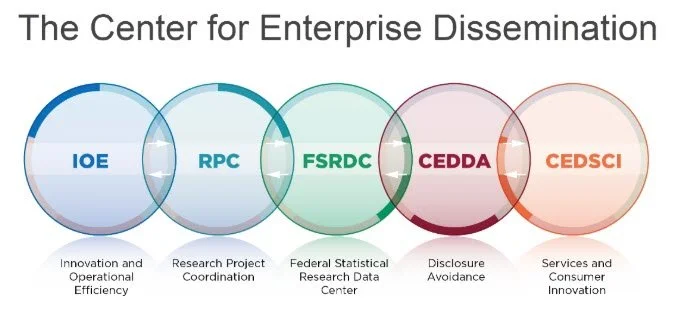
Outcome: Enduring Capability
The Center for Enterprise Dissemination (CED) assures that the Census Bureau can effectively disseminate the maximum amount of high-quality data about the Nation's people and economy while fully meeting the Census Bureau's legal and ethical obligation to protect the confidentiality of respondents and the information they provide.
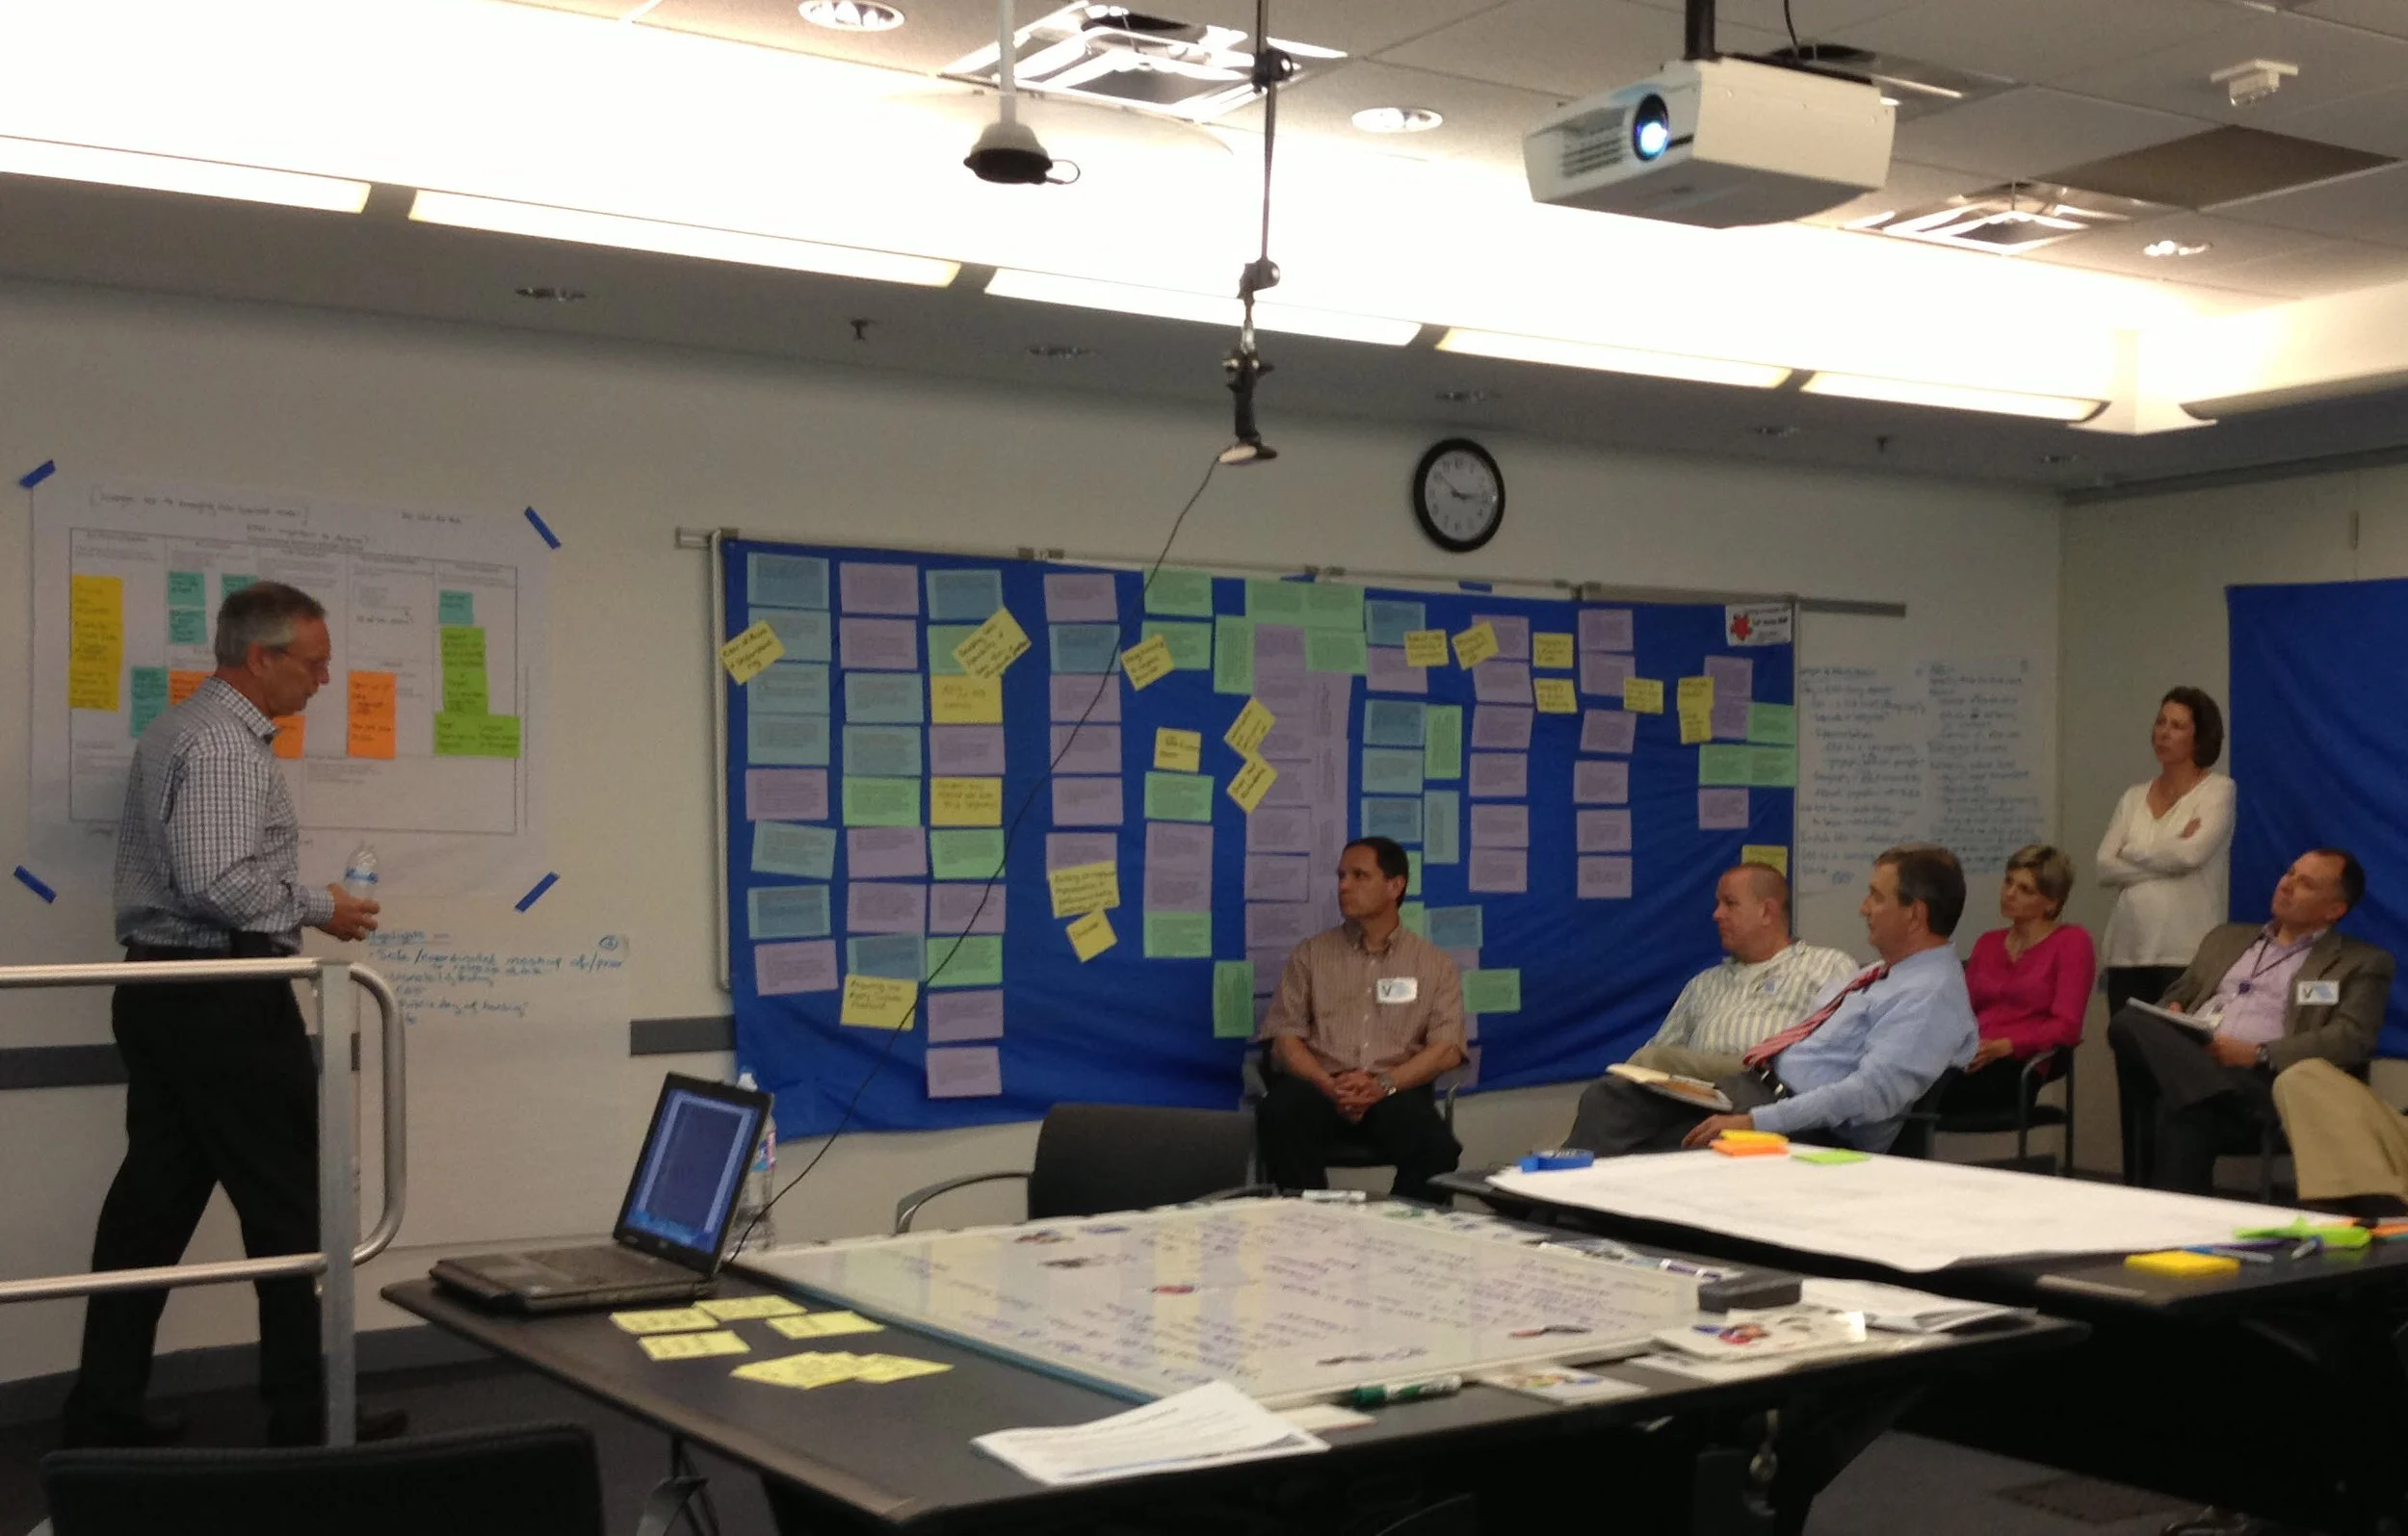
Photo: The Census Chief Technology Officer briefs the Census Bureau Director and teammates on the “What Americans Want” scenario. The Affinity Analysis of the original problem statements / pain points is on the sticky wall in the background.
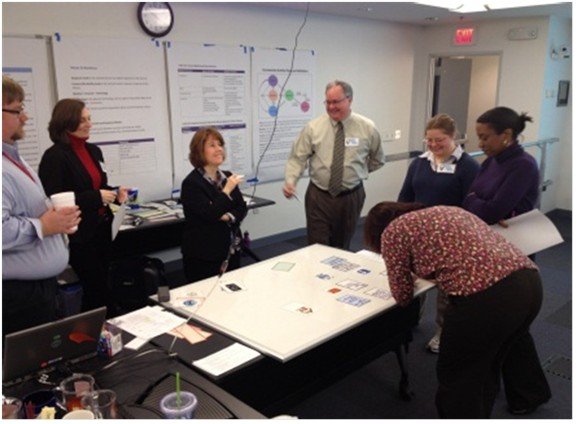
Photo (above): Steve Jost, co-chair of the Data Dissemination Task Force (far right), briefs fellow Task Force members on a future state scenario created through collaborative scenario development.
Graphic (below): High-level roadmap of integrated critical change activities in five capability areas.
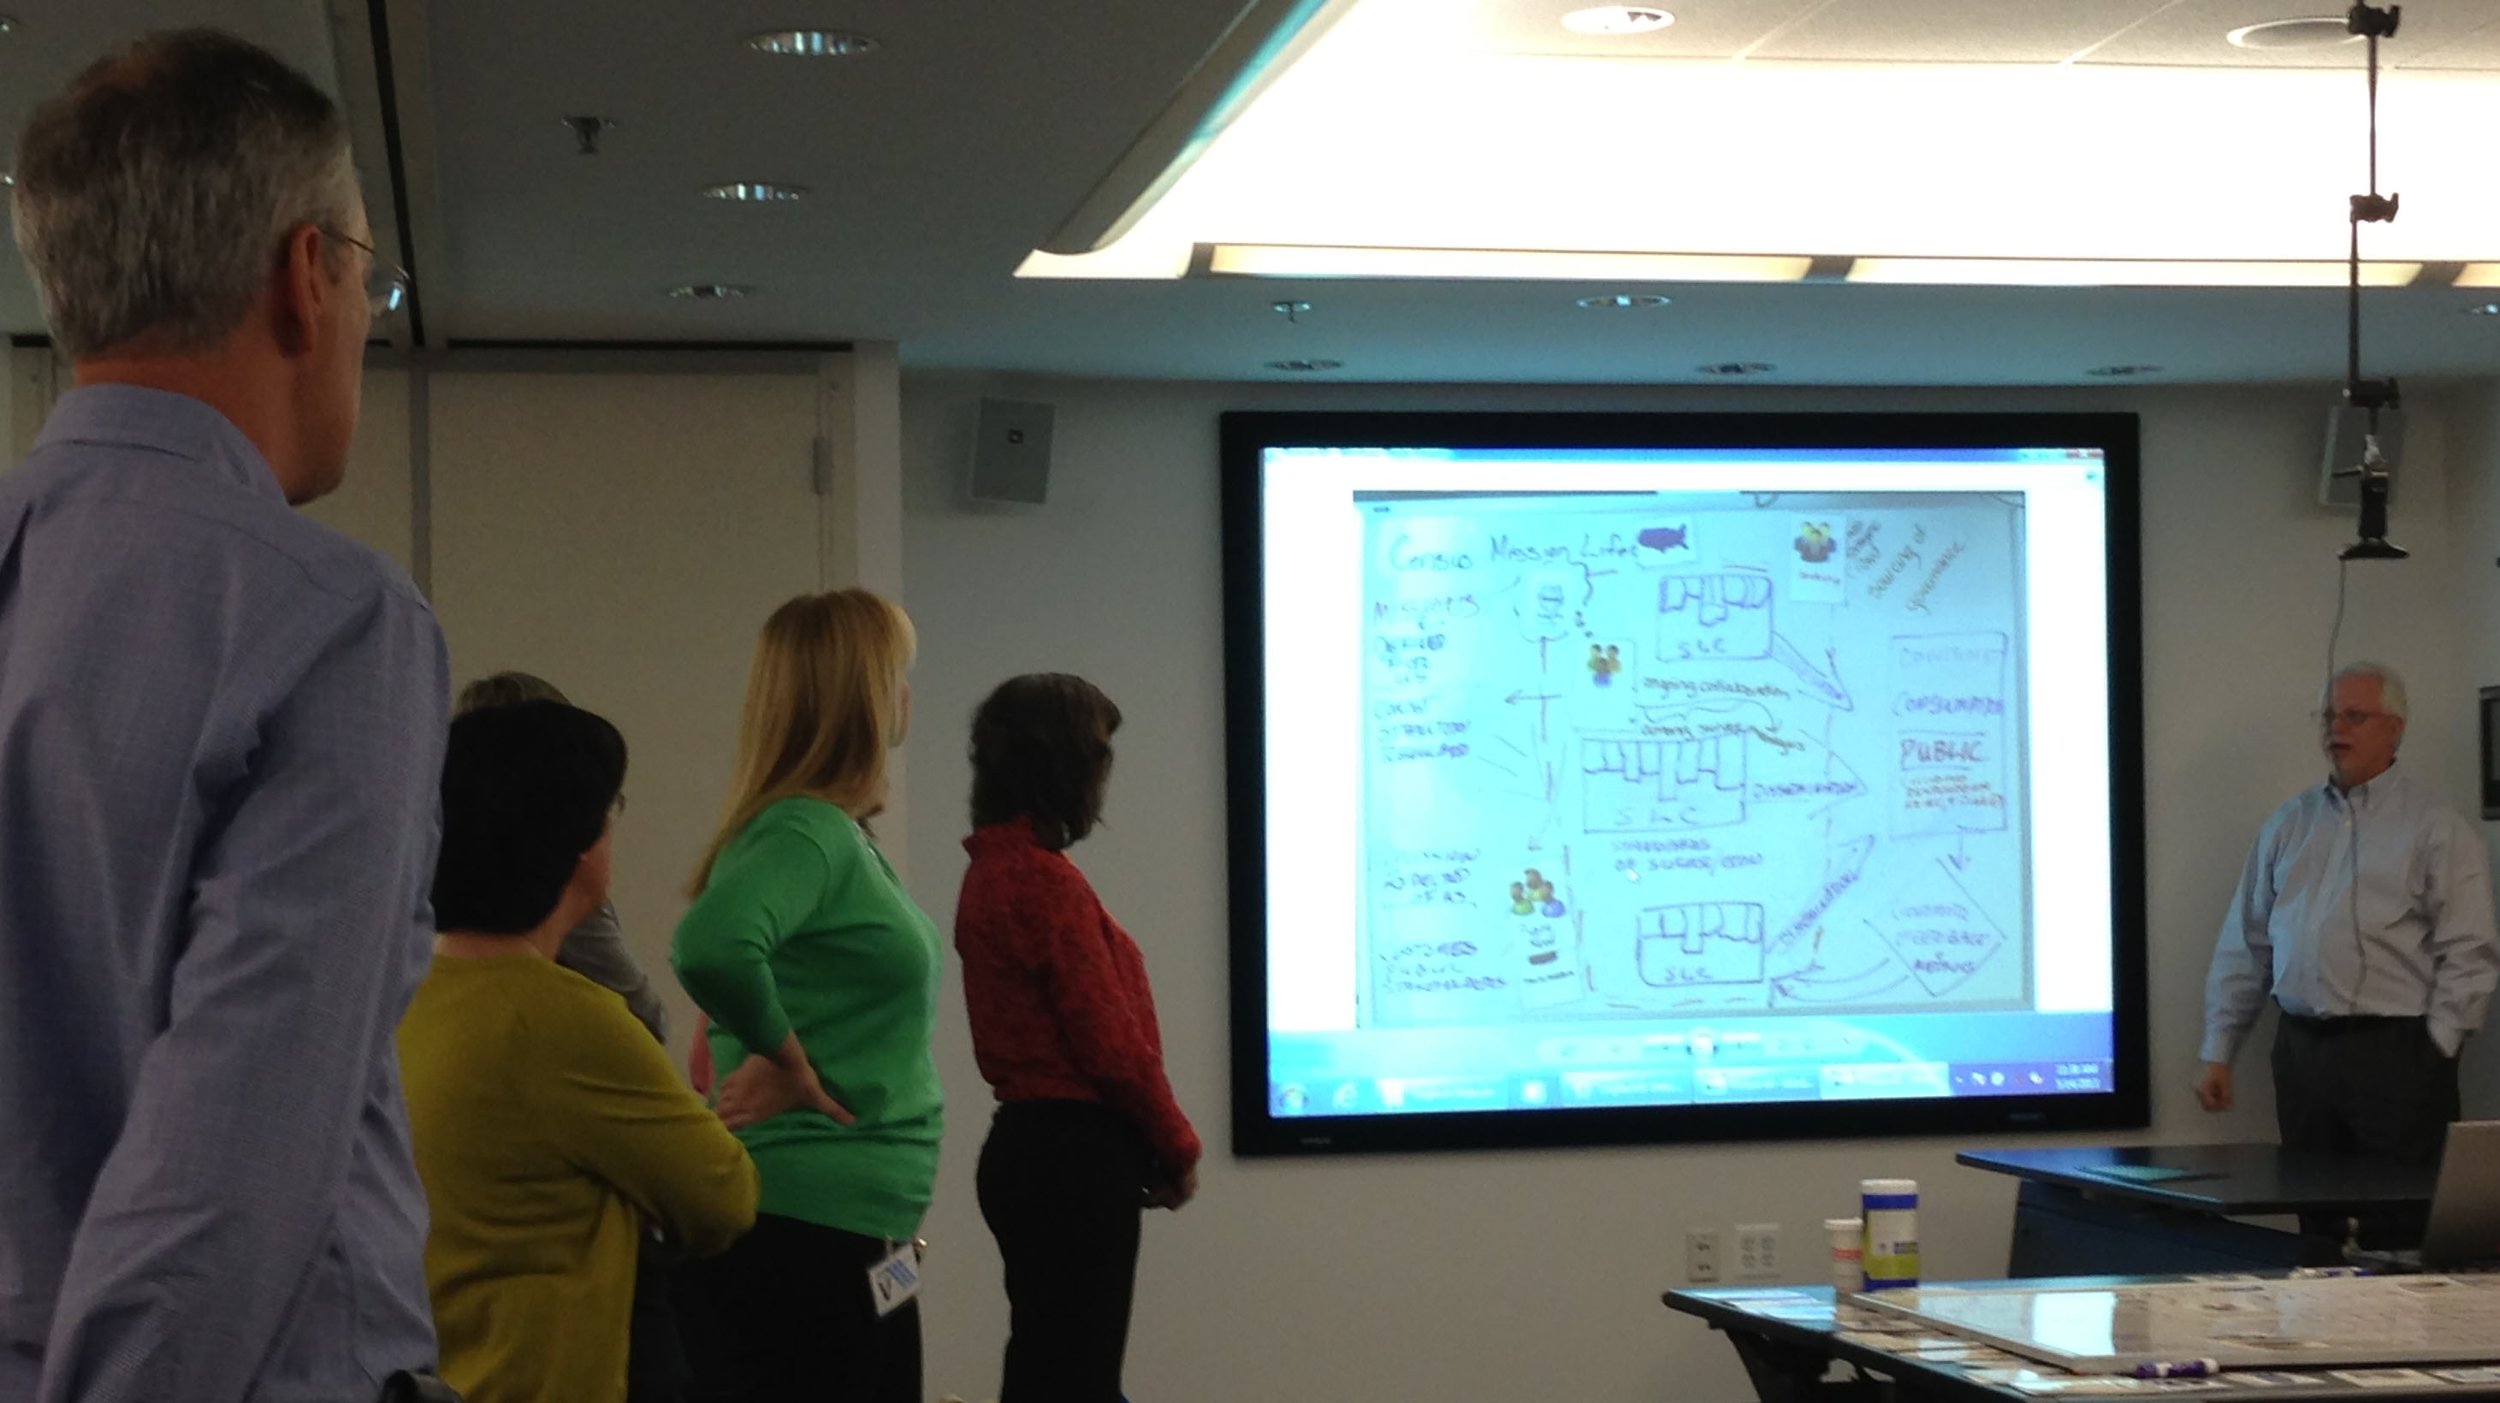
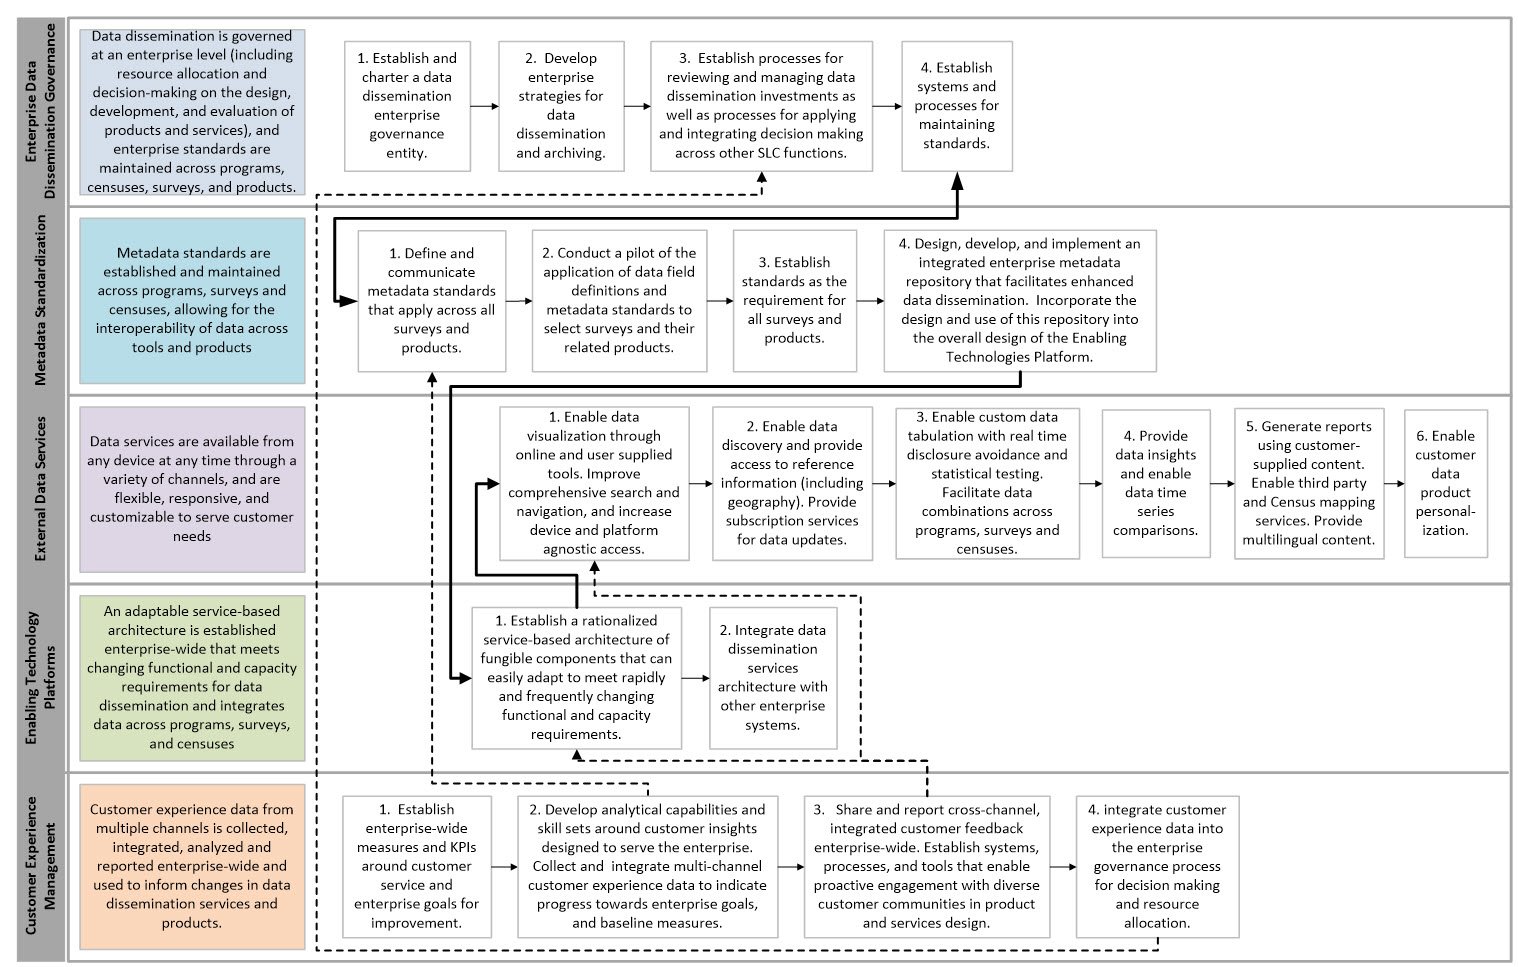
Image: The comprehensive roadmap that maps key steps to the five capability areas of the Census data dissemination environment.
Methods and Tools
Affinity Analysis — structure over 100 problems and pain points
“Big picture” landscape — front-stage / back-stage to define problem space
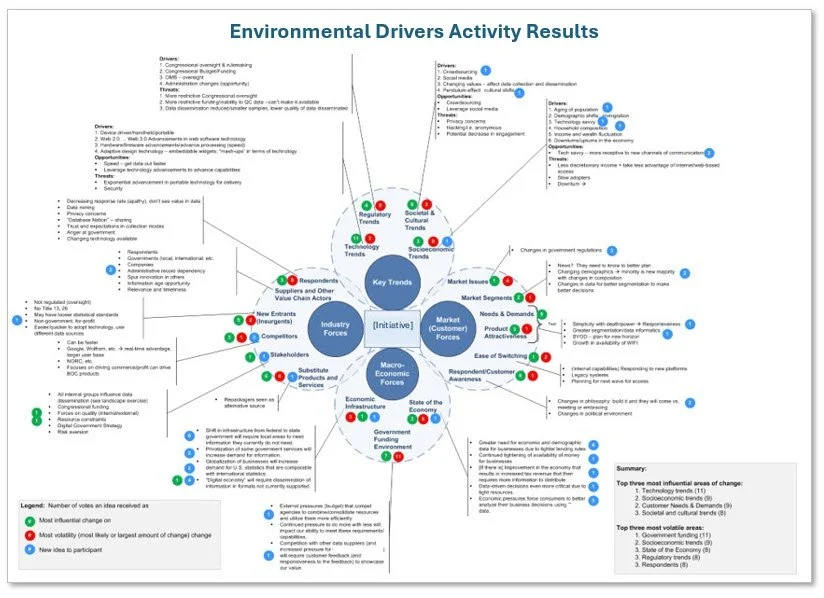
Environmental drivers — Identify, assess, and prioritize external influences
Scenario Development
Collaborative storytelling and whiteboarding
Structured summaries to capture outcomes, actions, risks
Business model generation templates
Observations and Lessons Learned
Simple, large format graphics: Using a simple graphic paired with structured discussion prompts effectively fosters shared understanding, key insights, and alignment.
Silent affinity analysis quickly organized over 100 diverse problem statements into a cohesive set of guiding capabilities.
Storytelling for scenario development helps to make the future tactical. Creating multiple story prompts to describe “a day in the life of” the personas of customers and their differentiated needs.
Working in small groups and dot voting gives everyone a voice in the process.
Time-boxed activities maintain focus and drive outcomes; after four hours of collaboration, the Task Force collectively reimagined the data dissemination environment.
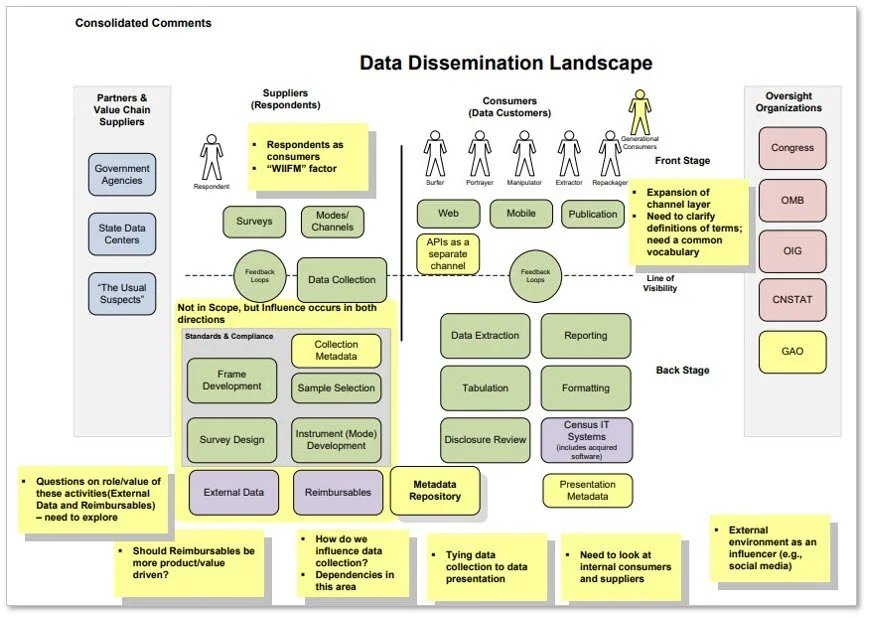
The consolidated high-level shared learnings from using a simple front-stage / back-stage diagram of the Census Data Dissemination environment. Discussing this graphic generated shared learning, stakeholder alignment, and key insights.
The transcribed outputs of the Environmental Drivers activity. The colored dots are the voting results to identify the most volatile, most impactful, and biggest opportunity drivers.
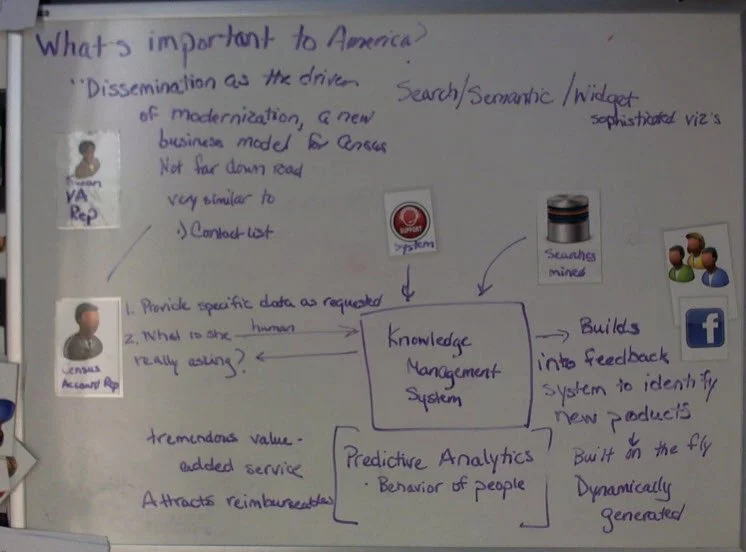
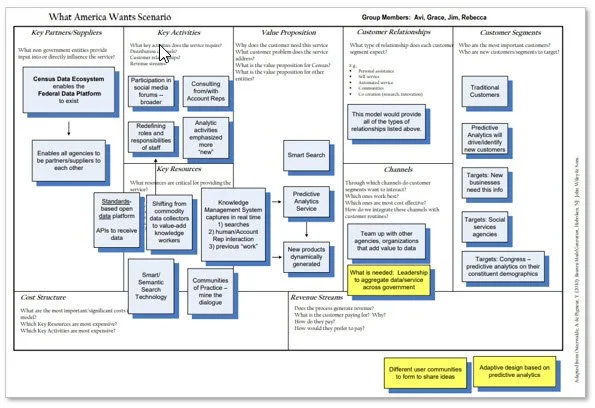
The “What America Wants” future state scenario summarized in a business model generation template.